Note
Go to the end to download the full example code.
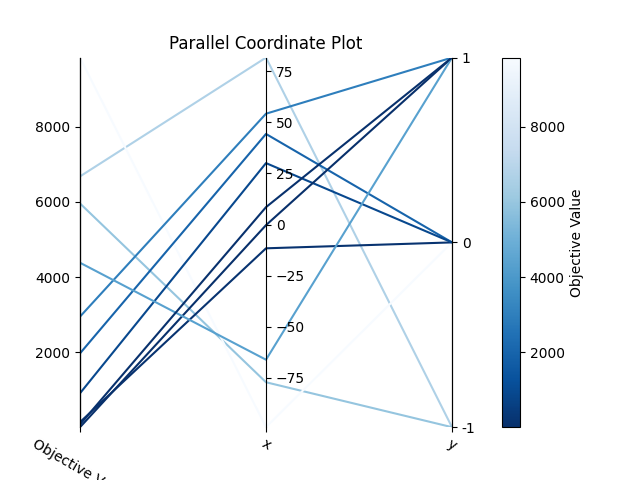
plot_parallel_coordinate
- optuna.visualization.matplotlib.plot_parallel_coordinate(study, params=None, *, target=None, target_name='Objective Value')[source]
Matplotlibを使用してスタディの高次元パラメータ関係をプロットします。
注意: パラメータに欠損値がある場合、欠損値を含むトライアルはプロットされません。
See also
使用例については
optuna.visualization.plot_parallel_coordinate()を参照してください。- Parameters:
target (Callable[[FrozenTrial], float] | None) –
表示する値を指定する関数。
Noneでstudyが単一目的最適化に使用されている場合、目的値がプロットされます。Note
studyが多目的最適化に使用されている場合はこの引数を指定してください。target_name (str) – 軸ラベルと凡例に表示するターゲットの名前。
- Returns:
matplotlib.axes.Axesオブジェクト。- Return type:
Note
バージョン 2.2.0 で実験的機能として追加されました。新しいバージョンでは予告なくインターフェースが変更される可能性があります。 詳細は https://github.com/optuna/optuna/releases/tag/v2.2.0 を参照してください。
The following code snippet shows how to plot the high-dimensional parameter relationships.
/mnt/nfs-mnj-hot-99-home/mshibata/sandbox/optuna-documentation-plamo-ja/optuna-doc-plamo-translation/tmp-optuna/docs/visualization_matplotlib_examples/optuna.visualization.matplotlib.parallel_coordinate.py:25: ExperimentalWarning:

plot_parallel_coordinate is experimental (supported from v2.2.0). The interface can change in the future.


<Axes: title={'center': 'Parallel Coordinate Plot'}>
import optuna


def objective(trial):
    x = trial.suggest_float("x", -100, 100)
    y = trial.suggest_categorical("y", [-1, 0, 1])
    return x**2 + y


sampler = optuna.samplers.TPESampler(seed=10)
study = optuna.create_study(sampler=sampler)
study.optimize(objective, n_trials=10)

optuna.visualization.matplotlib.plot_parallel_coordinate(study, params=["x", "y"])
Total running time of the script: (0 minutes 0.108 seconds)