optuna.visualization
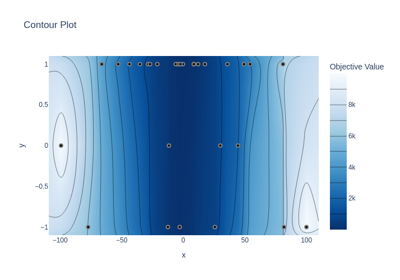
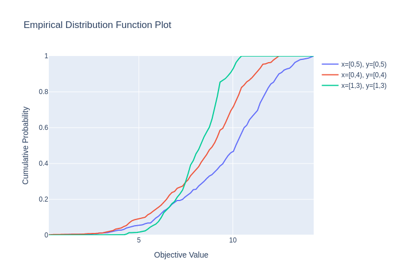
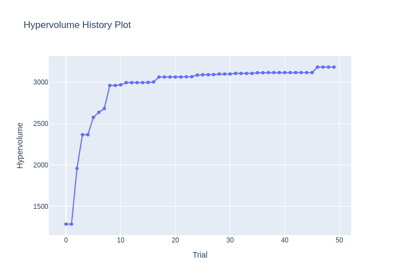
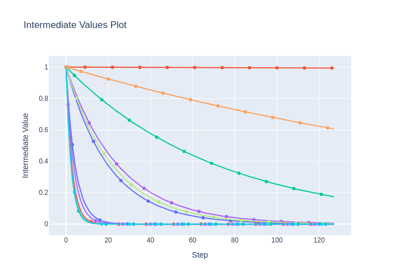
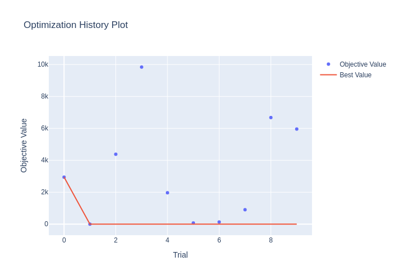
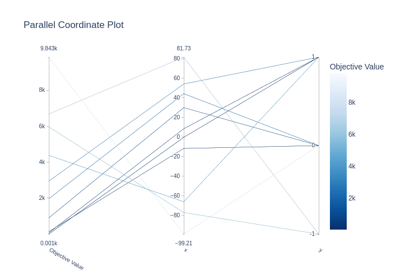
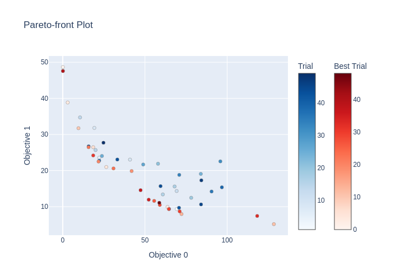
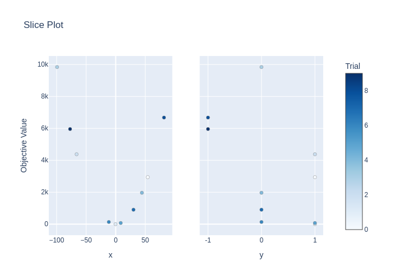
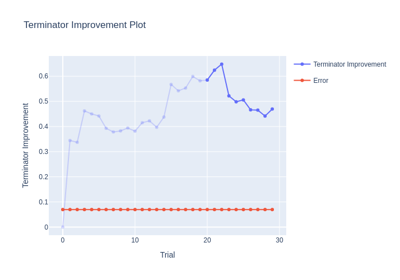
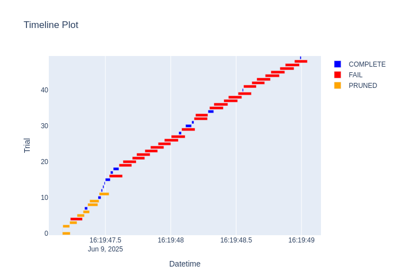
The visualization module provides utility functions for plotting the optimization process using plotly and matplotlib. Plotting functions generally take a Study object and optional parameters are passed as a list to the params argument.
Note
In the optuna.visualization module, the following functions use plotly to create figures, but JupyterLab cannot
render them by default. Please follow this installation guide to show figures in
JupyterLab.
Note
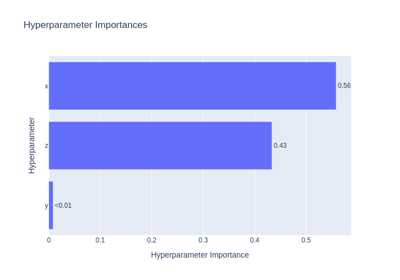
The plot_param_importances() requires the Python package of scikit-learn.
Gallery generated by Sphinx-Gallery
Note
以下の optuna.visualization.matplotlib モジュールは Matplotlib をバックエンドとして使用します。
See also
ハイパーパラメータ最適化の結果を可視化する チュートリアルでは使用例とともに解説しています。